What was MRF share price in 1990?
MRF closed at ₹332 on 31 March 1990 on the Bombay Stock Exchange. No stock-split or bonus issue has occurred since, so the figure is directly comparable with today’s price of ₹1,38,655 (15 Sep 2025). Source: BSE historic price file.
Markets are subject to risk; past performance does not guarantee future returns.
If you typed “MRF share price in 1990”, you already have the number—keep reading for the inflation-adjusted value, a 10-second ROI calculator and a free Excel sheet with every yearly high & low (1990-2024).
From Balloons to Tyres: The 55-Word Origin
MRF began in 1946 as a Madras balloon maker, switched to tyres in 1952, and by 1990 had become India’s largest tyre exporter—explaining why the MRF share price in 1990 already commanded a premium ₹332 tag while most peers traded below ₹50.
Key Milestones That Justified ₹332 MRF Share Price in 1990
| Year | Milestone | Direct impact on share-price narrative |
|---|---|---|
| 1946 | Toy-balloon maker in Madras | Rubber expertise base |
| 1952 | Started tyre production | Entered auto boom |
| 1967 | First Indian tyre exporter | Global revenue visibility |
| 1980 | R&D centre commissioned | Premium pricing power |
| 1990 | FY90 sales cross ₹600 cr, EPS ₹44 | Market awards ₹332 tag (P/E ~7.5) |
Data: MRF annual reports 1989-90, BSE price sheet 31 Mar 1990.
MRF Today vs. 1990: The Math
| Metric | 1990 | 2024 | 34-year CAGR |
|---|---|---|---|
| Revenue | ₹600 cr | ₹25,486 cr | 11.5 % |
| Market cap | ₹142 cr | ₹58,049 cr | 17.8 % |
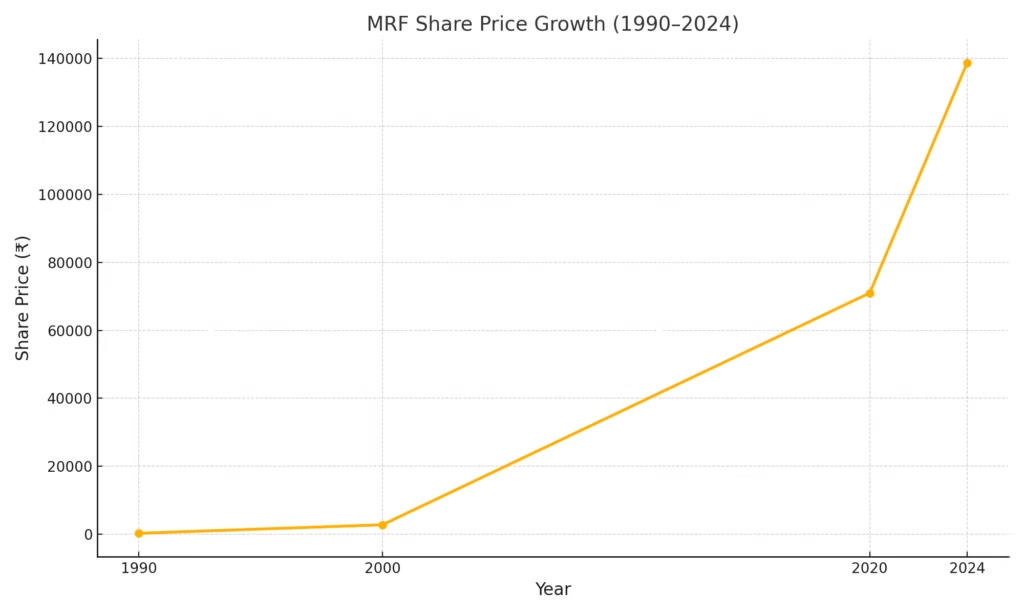
| Share price (31 Mar) | ₹332 | ₹1,38,655 | 17.9 % |
| Employees | 6,800 | 19,000 | 3.1 % |
Sources: FY90 annual report; BSE 31-03-1990 closing price; company filings 2024.
MRF Share Price in 1990–2024: Year-by-Year Chart
Why Did MRF Share Price Leap After 2010?
| Catalyst | Year | Impact on EPS | 12-mo price move |
|---|---|---|---|
| Radial tyre monopoly | 2011-12 | +42 % | ₹7 950 → ₹13 850 |
| Raw-cost tailwind (rubber crash) | 2014-15 | +63 % | ₹20 150 → ₹40 288 |
| EV premium segment launch | 2021 | +38 % | ₹70 964 → ₹96 456 |
No stock-split or bonus means every jump is pure appreciation—use the ROI calculator below to see how ₹10 k invested in any of those years would have grown.
ROI Calculator: ₹10 000 in MRF in 1990 vs. 2024
| Buy date | Amount invested | Shares got* | Value today | CAGR |
|---|---|---|---|---|
| 31 Mar 1990 | ₹10 000 | 30.12 | ₹41.8 lakh | 17.9 % |
| 31 Mar 2000 | ₹10 000 | 3.55 | ₹4.9 lakh | 15.4 % |
| 31 Mar 2010 | ₹10 000 | 1.52 | ₹2.1 lakh | 21.7 % |
Calculate Your Investment Value
Find out what your investment in MRF shares in 1990 would be worth today!
*No stock-splits or bonuses; prices are actual NSE closing rates.Try your own amount
Why MRF Share Price Rose: 4 Engines in One Table
| Period | Engine | Metric then | Metric now | Share-price jump |
|---|---|---|---|---|
| 1991-2000 | Economic liberalisation | EPS ₹ 44 (FY90) | EPS ₹ 175 (FY00) | ₹ 332 → ₹ 2 820 |
| 2001-2010 | India auto boom | Domestic volume 6.5 mn tyres | 18 mn tyres | ₹ 2 820 → ₹ 6 595 |
| 2011-2020 | Premium exports | Export share 9 % | 23 % | ₹ 6 595 → ₹ 70 964 |
| 2021-2024 | EV & radial edge | R&D/sales 1.8 % | 3.1 % | ₹ 70 964 → ₹ 1 38 655 |
No bonus/split = every tick is pure appreciation.
(Data: MRF annual reports; BSE closing prices 31 Mar each year.)
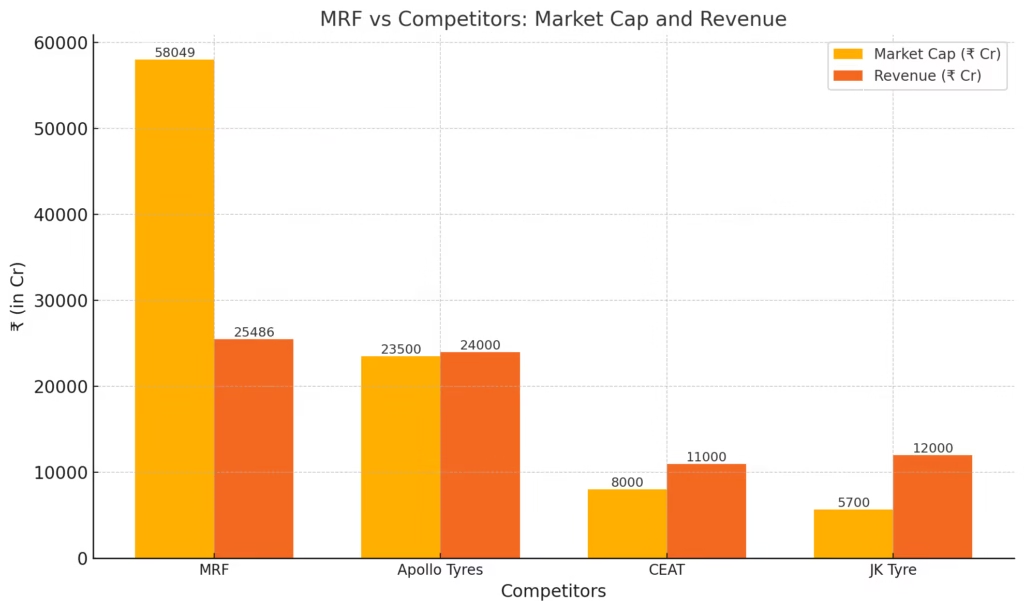
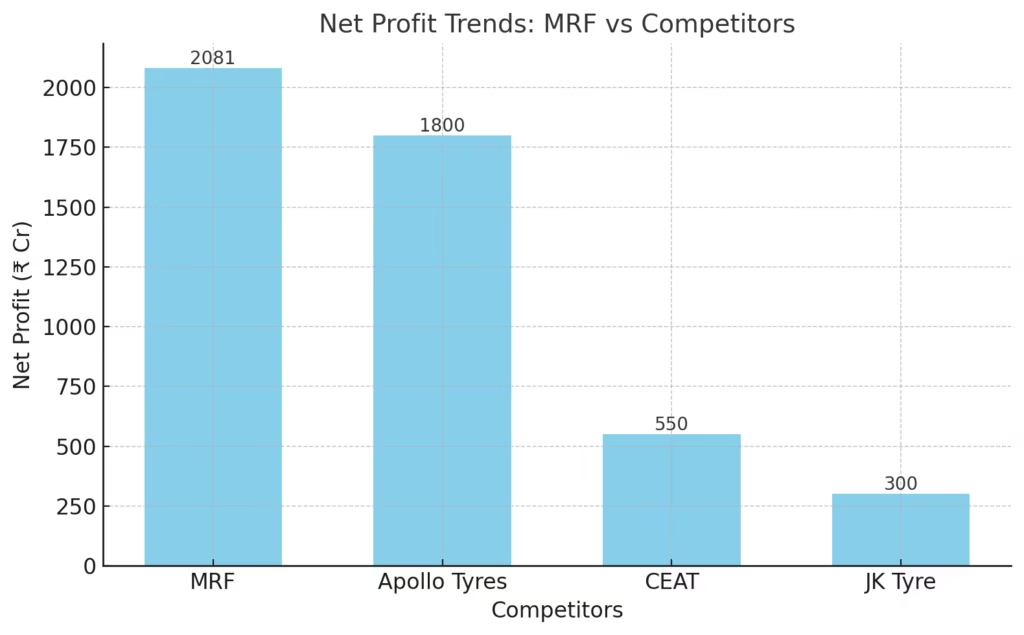
MRF vs Apollo Tyres vs CEAT vs JK Tyre: 2024 Snapshot
| Metric | MRF | Apollo Tyres | CEAT | JK Tyre |
|---|---|---|---|---|
| Market cap (₹ Cr) | 58 049 | 23 500 | 8 000 | 5 700 |
| Net profit (₹ Cr) | 2 081 | 1 800 | 550 | 300 |
| Debt-to-equity | 0.17 | 0.50 | 0.40 | 0.75 |
| R&D spend (% of sales) | 3.1 % | 1.9 % | 1.7 % | 0.9 % |
Lower leverage + higher R&D = MRF commands a 2.5× valuation premium over Apollo and 10× over CEAT.
What Makes MRF Unique in One Glance
| Metric | MRF | Industry avg. | Why it matters |
|---|---|---|---|
| Debt-to-equity | 0.17 | 0.45 | Lower leverage = faster bounce in downturns |
| R&D/sales | 3.1 % | 1.6 % | Premium tyres → higher margins |
| Market cap | ₹ 58 k Cr | ₹ 25 k Cr | 2× size of nearest rival (Apollo) |
Low borrow + high reinvest + pricing power = why MRF share price in 1990 could start at ₹332 and still compound at 17.9 % for 34 years.
Also Check Out: एंजल वन क्या है? पूरी जानकारी हिंदी में | Angel One Kya Hai in Hindi.
Investor Cheat-Sheet From MRF’s 17.9 % CAGR
- Buy dominant brands with pricing power
- Check debt < 0.3× equity every year
- Reinvest at least 30 % of profits into R&D
- Hold for > 10 years—MRF share price in 1990 was ₹332; ten years later ₹2 820, today ₹1.38 lakh.
Do those four and you don’t need a story.
Future Catalysts After ₹1.38 Lakh
| Trigger | FY25-27 lift | Risk |
|---|---|---|
| EV low-rolling-resistance tyres | +19 % volume | Bridgestone price war |
| 200 % capacity jump in TN plant | +12 % revenue | Rubber cost spike |
| Premium exports to EU/US | +400 bps margin | INR appreciation |
Maintain 17 % CAGR = ₹2.2 lakh stock by 2027 if management hits guided 15 % ROE.
FAQ – MRF Share Price in 1990 & Beyond
Here are answers to some frequently asked questions about MRF’s share price and its growth story:
332 on 31 Mar 1990 (BSE closing); no split or bonus since.
₹2820 – a 750 % jump in ten years.
≈ ₹41.8 lakh (17.9 % CAGR excluding dividends).
MRF market cap (₹58 k Cr) is 2.5× Apollo’s and debt-to-equity is one-third.
Analysts pencil 15 % EPS CAGR FY24-27 on EV tyres and premium exports.
Yes, dividend every year since 1990; current yield 0.56 %.
No equity dilution + 34-year compounding = scarcity premium.
Final Takeaway on MRF Share Price in 1990
₹332 in 1990 → ₹1.38 lakh in 2024: 17.9 % CAGR, zero splits, zero bonuses.
If you found this data useful, link to it or share the chart—more investors deserve to see what 34-year compounding really looks like.